For many application teams, predictive analytics might start as a one-off example to prove it can add value to their application, increase user satisfaction, and prove return on investment for the company. Regardless of whether you’re kicking off a small passion project or launching a large-scale initiative, the steps are essentially the same.
Follow these seven steps to start your predictive analytics project:
Identify a Problem to Solve

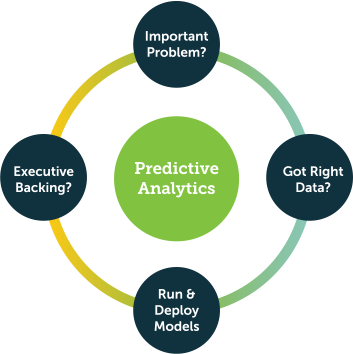
The first step is finding a problem that predictive analytics can help solve. This may seem simple, but in reality, many organizations have a hard time identifying a strong predictive analytics question. They end up adopting a solution (predictive analytics) in search of a problem, rather than the other way around. So, what’s the best way to identify a problem to solve with predictive analytics?
Start With the PADS Framework
Consumer applications have included predictive analytics for years. If you’ve ever used a flight cost predictor like Google Flights or browsed through movie recommendations on Netflix, you’ve benefited from predictive analytics. The same goes for every time you’ve purchased an item from Amazon and then received an email suggesting other items you might like.
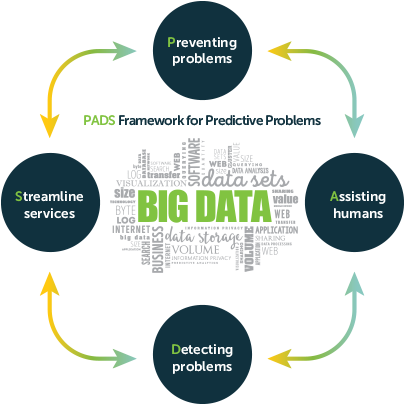
Every predictive analytics question should offer measurable and clear value. The PADS framework can help you identify a question that solves critical business needs. PADS stands for Preventing Problems, Assisting Humans, Detecting Problems, and Streamlining Services.
- Preventing Problems: Do you want to detect whether your application will enter a fail state before the fail state occurs? Or identify whether a customer is likely to churn before they cancel service? Preventing problems means flagging risks before they turn into money-losing issues.
- Assisting Humans: Inevitably, your best decision-makers will eventually move on to other jobs. Predictive analytics can help codify the processes your employees use to make good decisions, so new team members don’t find themselves adrift. Predictive analytics can record the factors of good decision making and help new users replicate them. For example, consider a gym member who hasn’t been going very often. Predictive analytics may forecast that this person is likely to churn soon—but what can staff do about that? Long-time employees may intuitively know they should offer a discount or personal training session to reengage the member. A predictive analytics application can codify those actions by recommending actions any staff member can use to prevent churn.
- Detecting Problems: Not every issue can be predicted and prevented. If your business commonly faces negative outcomes—for example, fraudulent insurance claims—predictive analytics can help you identify problems and quickly act. The signatures of a fraudulent claim aren’t always evident to a human user, but predictive analytics can flag these claims and other recurring problems that need to be addressed with urgency.
- Streamlining Services: Resource allocation is a perfect use case for predictive analytics. In any given week, it’s important to know how many new customers are expected, how many calls your call center will receive, and how many new claims your insurance company will process. This information will help you plan resources accordingly.
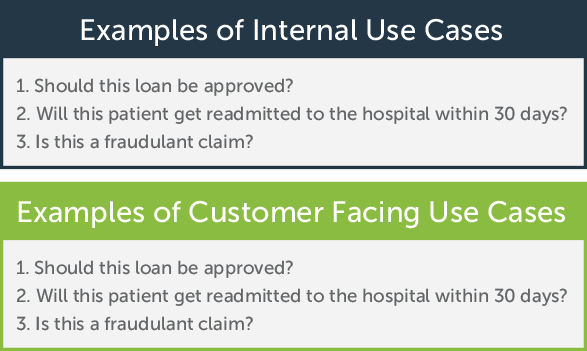
Business problems can range from significant to minor. To understand the possibilities, consider these examples of internal and external use cases for predictive analytics:
3 Requirements for Predictive Analytics Problems
Once you have a predictive question to ask, consider if that question meets these three requirements:
- The question, if answered, has a clear return on investment (ROI).
- It’s a question that can be answered with data you can access (See Step 2).
- The question, if answered, will give you a clear action or next step (See Step 5).
The first point about showing clear ROI is crucial. The fact is, any data-related project has a limited chance of success. Research from Gartner shows that between 60 and 85 percent of all Big Data projects fail. Why? It’s not that the technology has failed. It’s because Big Data projects disrupt the usual ways of doing business for an organization. When business leaders resist innovation, these projects often fail.
The best way to avoid failure is to find a project with clear ROI that everyone recognizes. Predictive analytics projects can demonstrate returns in a few ways:
- Loss Prevention such as preventing customer churn, machine failures, or appointment no-shows
- Increase Revenue by predicting who will respond positively to an offer, or who will purchase the product
- Increase Happiness by boosting customer satisfaction with tailored offers or better service
- Improve Processes such as staffing up for higher call volumes or more efficiently allocating staff resources
For example, let’s say you have a problem with unplanned application outages. Everyone can see this is a problem. It’s also an obvious money-loser: Estimates suggest that companies lose $9,000 per minute due to unplanned outages. Predictive analytics can help you detect the precursors of an unplanned outage, and it’s easy to count the ROI in terms of fewer minutes of unplanned outages per month.
The problem of unplanned outages demonstrates ROI in a couple of the ways listed above. It reduces or eliminates unplanned downtime and also increases customer satisfaction, since customers no longer get frustrated when the application unexpectedly crashes.
Still, even if your predictive analytics question can tie back to clear ROI, it may not be the best question for your business. Also ensure that you can actually access the data you’ll need in order to answer the question (we cover this in detail in the next step). Lastly, consider what the predictions will tell you. Will you have clear actions or next steps after getting your question answered? Read more about closing the gap between insights and action in Step 5.
Select & Prepare Your Data
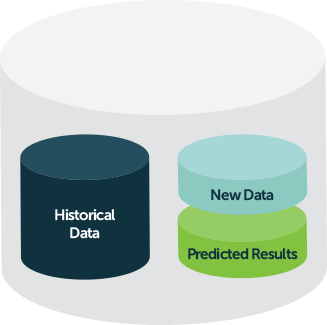
In order to run predictive analytics models, you need a dataset that can generate insights. In most cases, you’ll use both historical data, which is used to train your algorithm how to predict an outcome, and new data, which is where future predictions are done.
Most application teams store historical and new data in separate databases. But if you have one database for all your datasets, you can use a time filter (say, six months) on the historical data and a last-day or last-week filter to predict on new data.
Consider these factors when choosing your database:
- Data Volume: Traditional databases such as SQL Server, Oracle, PostGres, and MySQL can easily cope with datasets of around a terabyte in size. But if your dataset takes a jump in scale—think thousands of terabytes of petabytes—you’ll need to use a different database such as Amazon Redshift, Google BigQuery, Snowflake, or a Hadoop-based solution.
- Data Scalability: You’ll inevitably need to scale your predictive analytics data over time. Most organizations start by scaling vertically—adding more CPU or RAM to an existing machine. Cloud databases like Redshift scale nicely just by adding more nodes. You can also partition the data so different clusters handle data for different sets of customers. The next step would be to scale horizontally by creating and clustering replicas of the database. NoSQL databases such as Cassandra and Mongo DB are good at scaling horizontally by distributing where the data is saved.
After selecting your dataset and database, you’ll need to prepare your data. This process is almost never as simple as selecting the data you want and then training your model. Data can be inaccessible if it resides in a database that’s incompatible with your chosen analytics tool. It can also be inaccurate: According to research from Experian, companies believe that up to 25 percent of their data has been recorded incorrectly.
If it turns out your data source is incompatible with your predictive analytics solution, you may need to do some work to connect them. First, you can likely find (or potentially develop) an API that can establish information flow from your source to your tool of choice. When your project becomes more established, you may wish to port all your datasets to a different database that can be accessed directly.
Also leave time to clean your data. Up to half of the time spent on a predictive analytics project may be consumed by cleaning your data. You may need to deal with missing values, account for biased data, or augment your data.
Involve Others

Don’t wait too long to involve the stakeholders and other departments in your organization. Now that you’ve identified a business problem and the data that can help solve it, it’s a good time to get guidance from others.
Start with your organization’s stakeholders, including any executives or team leaders who will need to buy into the project. As stakeholders become advocates, they can help promote the initiative to others, making sure you get the cross-functional data you need and setting your project up for long-term success.
Now is also the time to consider who will actually be the end users of your predictive analytics application. Ask them about their goals, what problems they face, and how they hope to use predictive analytics. Try to gather a mix of people from different roles and departments, so you get well-rounded feedback on the solution. Don’t just pick the users who will agree with you. Also talk to the people who will be maintaining the solution and integrating it with the rest of your IT operations. If they don’t like working with what you’ve created, they could kill it because it’s too complicated to put into production and impossible to maintain over time.
Run Your Predictive Analytics Models
You’ve chosen a problem to solve, gathered your data, and gotten feedback. Now it’s time to choose a predictive analytics model that’s suitable for your task. Most predictive analytics questions will use one of these five common models:
- Classification Model: Answers a yes/no question. For example: Is this customer about to churn? Will this loan be approved? Is this a fraudulent transaction?
- Clustering Model: This is useful for sorting data points into groups. For example, you may wish to find the group of customers within your database who are most likely to be unsatisfied. You may need to further sort them into categories based on the kinds of problems they are likely experiencing. The clustering model can quickly sort these individuals with a high degree of accuracy.
- Forecast Model: This model predicts numbers – such as how many customers are likely to convert within a given week, how many support calls your call center will receive per hour, and how much inventory you should keep on hand.
- Outliers Model: This model highlights anomalies in your data. For example, it might record a spike in support calls, which could indicate a product failure that might lead to a recall. It could find anomalous data within an insurance claim and find an example of fraud. It could even find unusual information in your NetOps logs and notice the signs of impending unplanned downtime.
- Time Series Model: A time series is a sequence of data points captured in a timely order. For example, the number of daily calls received in the past three months; sales for the past 20 quarters; and the number of patients who visited a given hospital in the past six weeks. Time series is a powerful way to understand how a metric develops over time, and is often more accurate than other models which don’t consider time as a metric.
The analytics model you choose will depend on what question you ask. For example, if you manage a call center and want to forecast volume, you may ask: “How many calls will I get tomorrow?” That is a forecasting question. But you could also ask a binary question such as: “Will I get more than 200 calls tomorrow?” Since the answer will be yes or no, this is a classification question. Put another way: If you have the staff to handle 200 calls, then you will likely want to know if you’ll get 200 calls or not (so you’d ask the classification question). But if your goal is to identify how many calls you’ll receive tomorrow so you can staff accordingly, you would ask the forecasting question.
Close the Gap Between Insights & Actions

No information is valuable in a vacuum. Unfortunately, many predictive analytics solutions fail to empower end users. They deliver insights, but don’t tell users what to do with the information—much less let them take action without leaving the application. This disconnect wastes time and interrupts your users’ workflows.
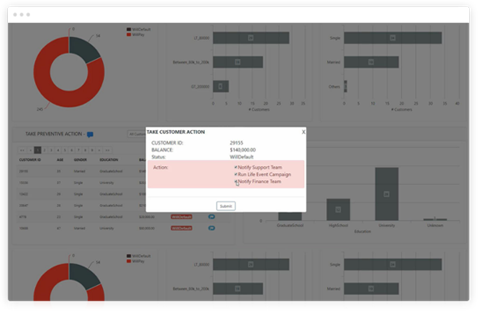
For a predictive analytics project, you need to think hard about not just delivering the information, but also empowering your users to act on it. Consider a customer churn application, in which the predictive analytics model has found some customers who are likely to churn soon. How can you make that information useful? First, you must get it to the right people. Then, you should suggest next steps based on the information, and ideally let users take action without leaving the application.
When you’re developing your predictive analytics solution, consider who needs to know about it and what they may want to do about it. For our customer churn example, you’ll probably want to let the customer support and account management teams know. And depending on your business, you may want to offer those customers a promotion, schedule an official check-in meeting, or discount their renewal price. The key is to make it easy for your end users to see insights and take action within your application.
Build Prototypes
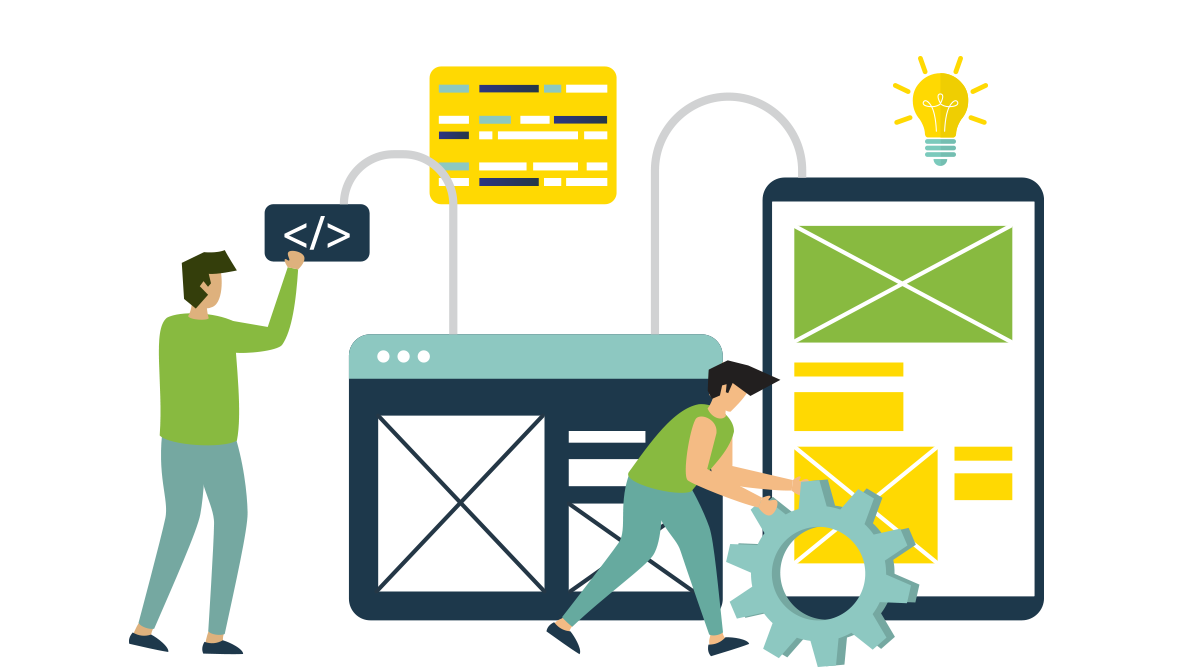
Creating rapid proofs of concept can help you get to a final product. Start with something simple, and give it to your end users and stakeholders to beta test. These will be the first users of your product, and their feedback will shape the direction of your predictive analytics solution. Incorporate their suggestions and slowly expand your beta test to others in the organization. Focus on small wins, which will add credibility and get more exposure for your project.
Chances are, your first few versions won’t be quite right—and that’s okay. It may take a few iterations to get to a minimum viable product (MVP) that’s both usable and valuable. The MVP doesn’t have to be perfect. As you’ll see in the next step, you have plenty of time to release updates and make improvements.
Iterate Regularly

As your project evolves, continuously engage with your testing group to review progress and incorporate new feedback. As you make changes, fix bugs, and test new models, you’ll improve the overall experience.
You should also stay aware of new predictive analytics features available on the market. As you iterate, you can make continuous improvements and steadily evolve your application into a newer, better product.
Conclusion
It has often been noted that “perfect is the enemy of good.” Don’t wait for everything to align perfectly. A flawless predictive model might tell the future with 100 percent accuracy—but it’s impossible to get those kinds of results. On the other hand, a good predictive analytics model might have 80 or 90 percent accuracy. That could mean the difference between success and failure for your business.
On your road to predictive analytics, remember that it’s inevitable to face some roadblocks. But if you start small, keep an open mind, and constantly ask for feedback, you’ll set your project up for success.