How do you make sure your predictive analytics features continue to perform as expected after launch? How do you improve performance over time?
In this chapter, you’ll learn how to maintain and enhance predictive analytics over time. We’ll give you guidelines for when to refresh your models and best practices for refining models.
Know When It’s Time to Refresh

In the past, developing traditional predictive models took so much time and effort that, once deployed, they were often used for years before being refreshed. Over that time, predictive accuracy would atrophy. As conditions changed, the gap would widen between the trained data models and the data they were analyzing in the real world.
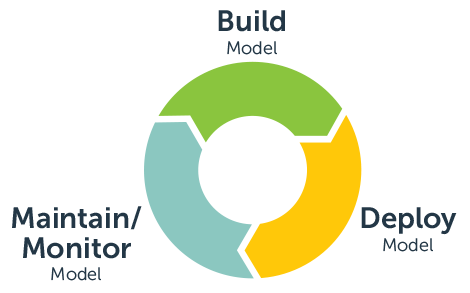
Today, with machine learning and embedded analytics platforms, models can be refreshed much more frequently. Retesting and updates happen in months or even weeks.
Application teams can use these three common methods for determining when to initiate model retesting and updating. They can be used exclusively or in combination.
- Seasonal. In many industries, such as retail and hospitality, customer behavior changes seasonally. It makes sense to refresh predictive models just before these cyclic patterns start to shift.
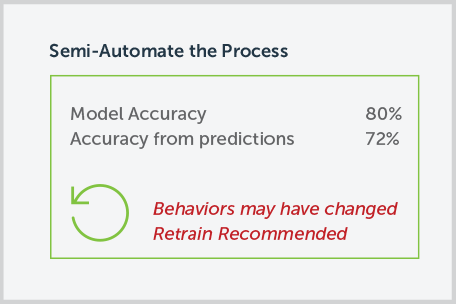
- Measurement-based. By measuring model accuracy at frequent, random points in time, you’ll pick up early signs of a predictive falloff. If your model was performing with 80 percent accuracy at launch and it’s now at only 70 percent, that’s a sure signal the behavior of the model (based on the data it was trained on) is no longer what it’s actually seeing in new data coming in. Perhaps business conditions are morphing, or a new customer behavioral trend is emerging. Customers may also change their behavior in response to new products or sales campaigns launched by your user organizations or their competitors.
- Activity-based. You can get ahead of behavioral changes from such actions by including a proactive model refresh. Add it as part of new product go-to-market plans or campaign strategies.
Boost Predictive Performance
Over Time

Updates not only prevent accuracy from backsliding, they can also boost performance going forward. The beauty of machine learning is that as algorithms analyze more and more of your customers’ data over time, they generate smarter and smarter predictive models with each refresh.
You can also help ML technology along by augmenting or enhancing the data. Here are a couple of ways to do that:
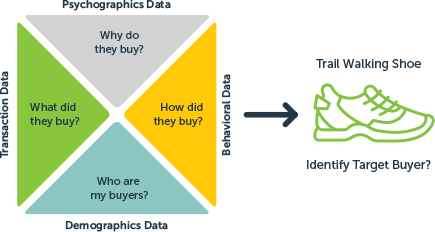
- Data Variety. Increasing the variety of input data leverages the ability of machine learners to discover complex multivariate patterns. Options include capturing more transactional detail and buying behavior from customer purchases, expanding the range of demographic data pulled from public and private sources, and tapping psychographic data from social networks, online activity, or third-party aggregators. Increasing data quantity and variety may also help counter some of the data problems we reviewed in Chapter 5.
- Model Refinement Based on Additional Performance Metrics In the previous chapter, we talked about establishing a pre-launch performance baseline by measuring model accuracy. For instance, with a churn model, what percentage of its predictions for both CHURN and NO CHURN were correct?
Depending on your application, it may be useful to measure additional dimensions of model performance, which could suggest ways to improve further:
Sensitivity measures the number of correct “yes” predictions as a percentage of actual “yes” outcomes.
Going back to our churn model example, that means: What percentage of customers who churned did it predict? A model with 85 percent specificity will identify 85 percent of churned customers. The fact that it misses 15 percent may be important in highly competitive markets where businesses are fighting to retain valuable relationships.
Sensitivity is an even more important measure for a healthcare application, where the model might, for example, be predicting patients at high risk for cancer. A 15 percent error rate—where the model predicts NO CANCER for patients who actually get cancer—could prevent crucial screening and early intervention treatments.
Specificity measures the number of correct “no” predictions as a percentage of actual “no” outcomes.
For the churn model, that means: What percentage of customers who did not churn did it predict? A model with 90 percent specificity will identify 90 percent of NO CHURN customers. That’s useful because businesses can focus their retention efforts on customers it predicts as CHURN, which will be a very reliable identification. The 10 percent of NO CHURN customers erroneously identified as CHURN are no problem, since giving them extra attention won’t hurt—and may even improve— retention.
Usually there is a tradeoff between sensitivity and specificity. So if sensitivity is more important for your application, you can increase it by lowering your threshold for specificity, and vice versa.
One way to make such refinements is through the data sampling methods described in Chapter 5 as a correction for data imbalance problems. These same techniques can also be used to refine model performance. In the churn example, you could increase the model’s sensitivity by down-sampling the number of data points in the majority class (will not churn) or up-sampling the number of data points in the minority class (will churn).
How to Adapt to
Changing Business Requirements

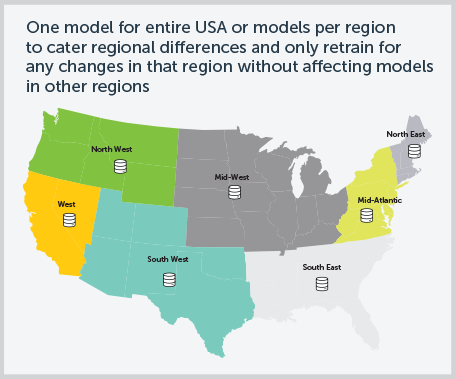
To maintain and improve model performance, application teams should build in periodic re-training. But that may just be the start. Any time you want to use your model in a new way—such as in a market where customer behavior is likely to be different from the data you originally used for training and validation—you’ll need to re-train your models.
For instance, consider a model you trained using historical data from the East Coast. If you now want to roll your predictive analytics features out to customers in other parts of the country, you’ll need to re-train with data from those regions. The same goes for adapting models to different customer segments, or to a new product or line of business.
Conclusion:
The Possibilities of Predictive Analytics

Embedding predictive analytics is the number one capability in product roadmaps today—and it’s easy to see why. Leading companies across industries are seeing big benefits, including:
- Reducing customer churn
- Detecting fraudulent transactions and invoices
- Reducing machine downtime
- Identifying high-risk patients
- Boosting sales through targeted promotions
In this guide, we’ve given you all the tools you need to start your predictive analytics journey so you, too, can reap the benefits of a successful solution:
- Chapters 1 and 2 covered the value of predictive analytics and the challenges you may encounter, plus real-world industry examples.
- In Chapter 3, we broke down the process of embedding predictive into seven easy steps, from identifying the problem you want to solve to building a prototype of your predictive analytics solution.
- Chapter 4 explored how to bring your predictive solution to market, including how to price and package analytics and identify your Minimum Viable Product.
- In Chapter 5, we gave you best practices to avoid common data problems and guidelines for optimizing your predictive algorithms and models.
- Finally, Chapter 6 showed how to maintain and improve your predictive models over time so they continue to perform as expected.
What to Look for in an Embedded Predictive Analytics Solution:
The market for predictive analytics solutions is massive—but not all of them are built to be embedded in your application. Embedding predictive analytics means your users can get powerful insights and act on information without ever leaving your application. Look for a solution that makes it easy to embed, scale, and maintain predictive analytics in your application.
Embeddable predictive analytics solutions are designed for product managers and developers to use, since they eliminate the need to understand statistical modeling, R, and Python. They reduce the burden on data scientists and free them up to analyze data and recommend actions. A predictive solution that’s designed to embed will also give you control to customize it, match your brand, and make it look and feel like the rest of your application.
About Logi Predict
Logi Predict makes it easy to add machine learning and predictive insights to your application. It’s the only solution built to make it easy for developers to embed, scale, and maintain predictive analytics.