Once you know what predictive analytics solution you want to build, it’s all about the data. The reliability of predictions depends on the quality of the data used to discover variables and generate, train, and test predictive models.
In this chapter, you’ll learn how to avoid data problems that could slow your time to market. We’ll also give you some guidelines for getting the most predictive power from your data and the best performance from your models.
Find the Data You Need

You’ve chosen a business problem you want to solve. Now, what data do you need to solve it?
Some of the data may be easy to obtain, while other numbers will require more time and effort to assemble. Fortunately, there’s no need to have everything in hand from the beginning. You shouldn’t wait until everything is 100 percent right to deploy a predictive model. If you do, you’ll be lagging behind competitors or facing totally different customer requirements. Instead of a perfect predictive model, aim to develop one that’s better than what you have in place now.
Start by building a model with a few essential data elements. Put the application out there and collect user feedback while you gather additional data. Bring new data elements into your model in subsequent releases to deliver incremental performance enhancements or additional capabilities.
Choose the Right Database

You’ll need to store three types of data for your predictive projects:
- Historical data for creating, training, and testing your models
- New data your models will analyze to make predictions, such as customer transactions from yesterday or last week
- Predictions (outputs) from your models
Historical data usually amounts to the biggest data volume. One terabyte of storage for historical data is a good baseline for most small and medium business’s predictive applications. Traditional databases like SQL Server, Oracle, PostGres, and MySQL usually work fine for this purpose, and they’re also adequate for generating predictions on new data.
If your application is targeted at significantly larger businesses, both your development team and your customers may need to store much more historical data, perhaps as much as 100 terabytes. And if your application requires collecting very detailed data from transactions or sensors, both the historical data you use for training and testing and the new data from which you’re generating predictions will rapidly multiply. In these cases, look at non-relational databases that scale vertically (by adding CPU/RAM resource nodes) and horizontally (by adding containers and clusters).
Practice Database Hygiene

It’s usually best to keep the three categories of data—historical, new, and predictions—in separate databases/tables.
In some cases, however, it may be preferable to use the same database/table for both historical and new data. This can be done by creating filters to separate the data. For example, a six-month filter could be used to access historical data, with a last-day or last-week filter for new data.
Within the category of historical data, you also want to separate the data for training your model from the data for testing it. Using the same data in both the build and validation stages would be like having exam questions ahead of the exam—a great score, but the results are meaningless because there’s no evidence anything has actually been learned. By creating two sections—one for training and the other for testing—you ensure a fair evaluation because you’re measuring the accuracy of your model on data it has never seen before.
Cleanse Your Data

Predictive models are only as good as the data they learn from. Accuracy of predictions depends on clean data. As with other business intelligence projects, the task of cleansing data has traditionally been lengthy—taking up as much as 60 percent of time in predictive projects.
Fortunately, that’s changing. Machine learning is increasingly being used to detect and resolve two of the most common data problems:
1. Missing values
To appreciate the value of machine learning, it’s helpful to understand some of the options for correcting this problem without it. In manual data cleansing, a typical approach has been to remove all the rows with missing values. But doing so can bias the data—for example, if most of the deleted rows are for males, that could bias the data against males. Also, removing a significant portion of usable data could impair predictive accuracy.
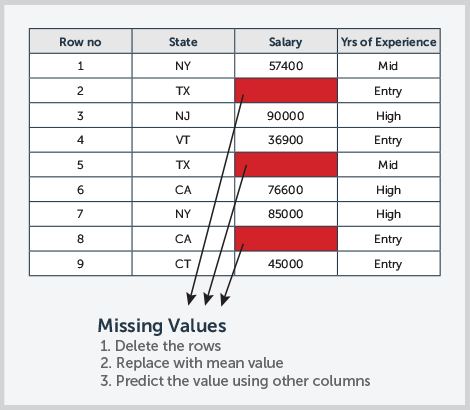
A more sophisticated approach would be to calculate the mean of other similar records—for example, filling in a salary value based on the mean salary for customers in the same age group. The problem is that age might not be the only—or even the best—predictor of salary.
Machine learning can resolve missing values faster and more accurately than manual methods. Instead of simply calculating the mean salary for an age group, algorithms can examine more complex relationships between multiple factors—for example, age group, work experience, education, and salary—and infer missing values based on these multidimensional similarities.
2. Outliers
Data points that fall significantly outside of the normal distribution for a particular variable can skew predictive models, especially when the training dataset is small. These outliers may be caused by errors in measurement, recording, or transmission of data. They could also be the unintended result of how the dataset was defined or simply be natural deviations in a population.
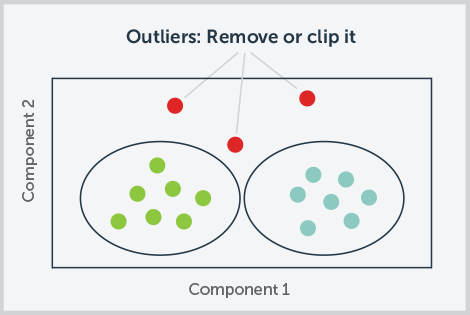
In any case, outliers need to be analyzed to determine if they contain valuable data or are just meaningless aberrations. Depending on which it is, there are various appropriate ways of dealing with outliers, including removal or replacement with the nearest reliable value. All these methods have traditionally required analytics expertise.
Machine learning makes detection even more critical, since results from ML-based predictive models can be significantly impacted by outliers. But machine learning also helps with detection. Feeding ML outputs to visualizations such as scatter plots is a fast, easy way to spot outliers. And ML tools can automate fixes, such as clipping values above or below specified thresholds. We expect to see more holistic, large-scale ML data cleansing solutions soon.

Avoid Bias in Your Data and Models

Models learn to predict outcomes by identifying patterns (correlations between specific input variables and outcomes) in historical data. So if there’s bias in your data—which there typically is—there will be bias in your models. If you don’t correct for it, the predictions your models make will be inaccurate, as they reinforce and perpetuate the bias.
Watch out for these two common types of bias:
1. Data Bias
Let’s say you’re creating a model to predict the best applicants for sales jobs. If you train your model with data on your current sales team, which has historically had a majority of young white males, then your model will learn patterns based on those characteristics.
In production, the model will then score young white males higher than applicants with other characteristics. You may not be able to fix the problem by just excluding the biased variables. Other variables could also be contributing bias—for example, zip code may be a proxy for race or age.
One way to correct for data bias is through over-sampling or under-sampling. Under-sampling works best when you have a large amount of data, while over-sampling is better when data is limited.
Imagine you want your model to predict a particular outcome like customer churn or propensity to buy a product. If your historical data contains 98 percent of customers who did not have this outcome and just 2 percent who did (or vice versa), then you have a class imbalance problem. The model you train from this data may not be very accurate at predicting the 2 percent outcome because it didn’t have enough data to adequately learn the characteristics that correlate with it. You can address this imbalance by either taking more rows of data in your sample from the under-represented outcome (over-sampling to augment the 2 percent) or fewer rows of data from the over-represented outcome (under-sampling to reduce the 98 percent).
Another approach is to use the Synthetic Minority Oversampling Technique (SMOTE). It uses over-sampling, but also fills in artificial data points—which serve as additional “synthetic” instances of the under-represented class—based on the existing data points.
2. Selection bias
Selection bias happens when the data you use to train your model differs in some significant way from the data it analyzes in production. The resulting predictions will be inaccurate and may also be unfair.
Here are the most common reasons for selection bias and how to avoid them:
Problems with how you apply your model. Beware of mismatches between your model and the population you’re applying it to in production. Imagine you’ve created a model to predict the best apartment rental candidates. If you’ve trained the model on historical data from a part of the city where there is a concentration of a certain demographic, and you then try to apply it to neighborhoods with quite different demographics, you’ll not only get poor performance at predicting good candidates, you may also produce discriminatory results.
Or consider a propensity-to-purchase model built to help expand a product’s market by identifying new customers. If the training data was exclusively drawn from the current customer base, it will be biased toward current customer characteristics. As a result, it may not be very good at identifying the characteristics of other potential market segments—and will overlook opportunities. You can reduce selection bias and improve performance by enriching the data with experiments that capture data outside of your current customer base.
Validate your model is working and establish a performance baseline

To validate that your model is working prior to launch, run it on your test data. This is historical data you’ve stored separately from the data you used to build the model. Since you already know the actual outcomes, you can measure how close the prediction gets to what happened in the real world.
Accuracy measures the total number of correctly predicted outcomes as a percentage of all outcomes.
You don’t need a model with 100 percent accuracy. To determine if you’re ready for your initial predictive software launch and to establish a performance baseline, compare your model’s accuracy with what your beta customers were achieving without it. If your customers were making mostly judgment-based “gut” decisions, the predictive analytics model simply needs to do better than that baseline.
Let’s say the model predicts customers likely to churn, and validation shows it correctly identifies 65 percent of customers in the historical data testing sample that actually did churn. While there’s room for improvement, this accuracy may be an order of magnitude better than judgment-based approaches companies often use to segment and target customers for retention programs.
Watch for Imbalanced DataWhile you don’t need 100 percent accuracy from your models, you do need to fix any problems of data imbalance that show up in validation testing.
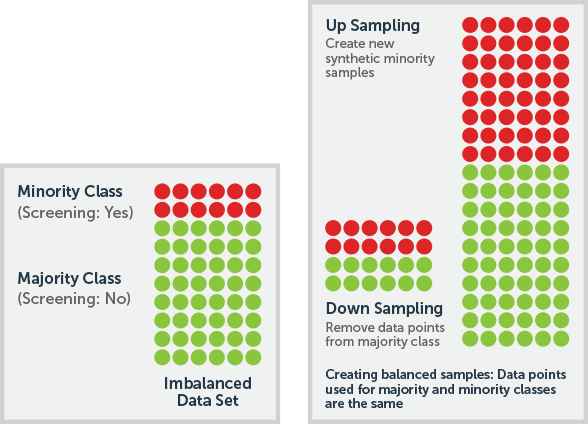
Imagine a healthcare application that predicts if a patient needs to be screened for cancer. In the historical data you’re using to train the model, 95 percent of patients do not need to be screened for cancer, and 5 percent do. This is an imbalanced dataset, as one class (patients who don’t need screening) has a huge majority over the other.
Depending on the application, this imbalance could be a serious problem. Let’s say validation testing shows that your model has an 85 percent accuracy rate overall. That 15 percent error rate may not seem like a lot, but if the model assigns NO SCREENING for patients that actually need to be screened, it could prevent crucial early intervention treatments. The consequences associated with those wrong predictions can be disastrous.
One way to fix problems like this is by sampling the data to balance it. Sampling involves equalizing the number of data points in majority and minority classes. You can do that by “down sampling” (removing some data points from the majority class) or by “up sampling” (creating new synthetic data points in the minority class using statistical inference techniques based on existing data points).
Once you’ve validated a reasonable level of model accuracy and have fixed any data imbalance problems, “call it good,” as they say, and move ahead to launch. Get your predictive analytics solution to market—then work on making it better. Since you’ve already established a performance baseline without predictive analytics, you can chart progress post-launch as you make incremental improvements.